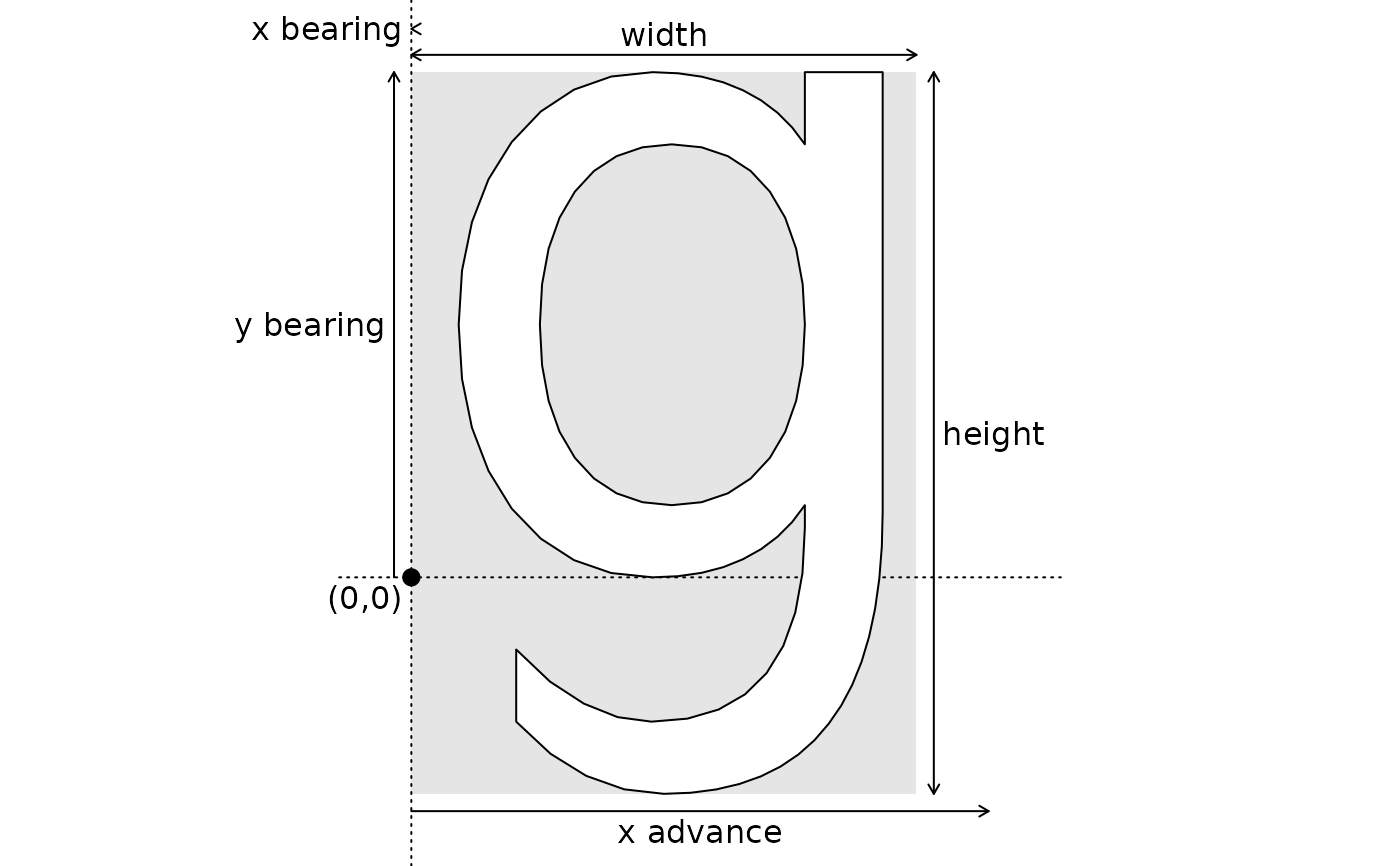
Create a visual representation of what the various glyph stats mean
Source:R/font_outline.R
plot_glyph_stats.RdThis function helps you understand the concepts of width, height, bearing, and advance by annotating a glyph with the various measures
Usage
plot_glyph_stats(
  glyph,
  family = "",
  italic = FALSE,
  weight = "normal",
  width = "undefined",
  size = 12,
  res = 72,
  variation = font_variation(),
  path = NULL,
  index = 0
)
Arguments
- glyph
The character to plot
- family
The name of the font families to match
- italic
logical indicating the font slant
- weight
The weight to query for, either in numbers (
0,100,200,300,400,500,600,700,800, or900) or strings ("undefined","thin","ultralight","light","normal","medium","semibold","bold","ultrabold", or"heavy").NAwill be interpreted as"undefined"/0- width
The width to query for either in numbers (
0,1,2,3,4,5,6,7,8, or9) or strings ("undefined","ultracondensed","extracondensed","condensed","semicondensed","normal","semiexpanded","expanded","extraexpanded", or"ultraexpanded").NAwill be interpreted as"undefined"/0- size
The pointsize of the font to use for size related measures
- res
The ppi of the size related measures
- variation
A
font_variationobject or a list of them to control variable fonts- path, index
path an index of a font file to circumvent lookup based on family and style